loader

Application Visualization Without Blind Spots

Expand application visibility. Deliver uninterupted customer experiences

Gain full application & infrastructure management with the NSP

The NSP fuses data between applications and infrastructure, establishing relationships and business context for identifying root cause and service impact.
qloud
qloud

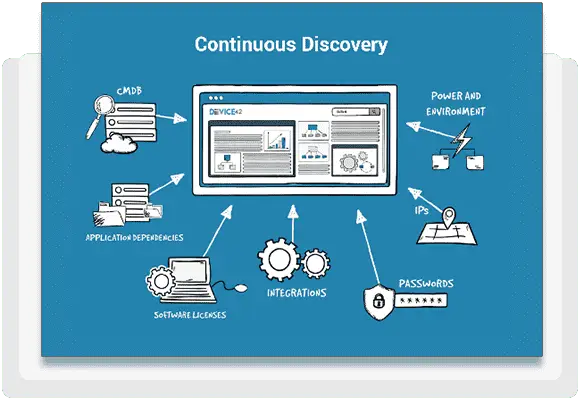
Application Dependency Mapping

Automated Service Impact Discovery, Dependency flow diagrams, Application Impact lists, Easy Impact Visualizations, and more!

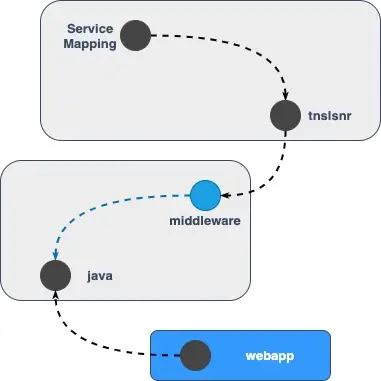
  • Agentless services and application discovery using native protocols
  • Agent based discovery available for sensitive and/or often disconnected devices
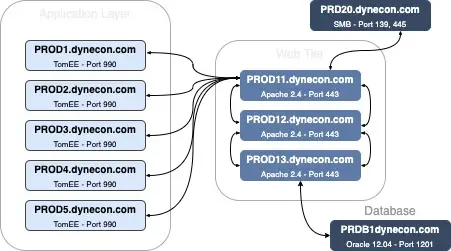
  • See all deployed applications, manufacturer / owner, version number and function
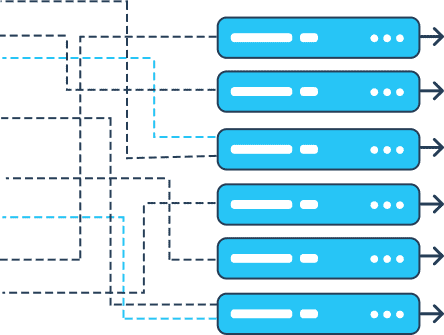
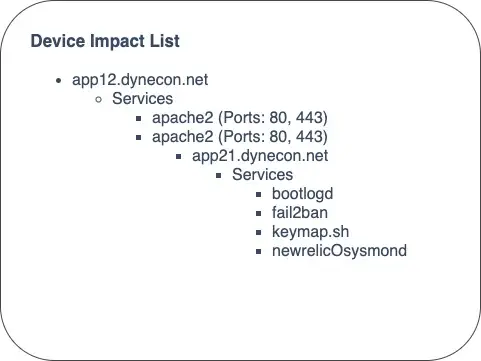
  • ‘Pin’ key services and Affinity Groups defines move groups & calculates impact charts for each; See a visual grouping of communication patterns
  • List all services, running or not, users, protocols & ports
  • Granular software and service details include install location, date, registry information, permissions, and configuration files for each software component!

Gain full-stack visibility

Combine APM data with extensive infrastructure data to gain full-stack visibility.

See infrastructure impact on applications

Map infrastructure and applications relationships to expedite root-cause analysis.

Understand business impact

Apply business-rich context to app and infrastructure relationships to minimize business risk.

Automate IT workflows

Populate app and infrastructure relationships into your CMDB to improve IT service management.

Ready yourself for Audit

No more last-minute gathering of information from disparate and often inaccurate places.

Faster cross-team collaboration

Common data between ITOps and application teams promotes collective problem solving.

  • Focus– Focus on executing changes, not documenting them
  • Webhooks– Trigger automation based on any infrastructure change with webhooks!
  • Monitor– Quickly detect installation of prohibited software
  • Well Managed– Schedule discoveries, and never think about them again
  • Build– Your infrastructure data is always up to date, and always audit-ready!

Discovery Driven Visualization

Dynecon quickly and thoroughly discovers your entire network using a variety of auto-discovery methods, automatically correlating the collected information:

Automated Service Impact Discovery

Dynecon creates a comprehensive map of your services, open and listening ports, and remote connections for Windows, Linux, and BSD machines.
  • Know what services are listening on what ports
  • Understand business impacts before moving applications
  • Visualize all the dependencies for a particular machine
  • Get a list view of the service and its remote dependencies
  • No need to configure expensive span ports to get dependencies between servers
  • Be confident about retiring or consolidating assets!

Map Dependencies

  • Reduce Service outages with predictable change and configuration management intelligence
  • Powerful, and easy to use!
  • Clearly show relationships between application components
  • Automatically generated

List out Impacts

  • Reduce Risk and potential downtime during cutovers, upgrades, and migrations by understanding interdependencies and connections!
  • Impact Lists provide the necessary details about the organizational groups using the applications.

Visualize your impacts